


Many volunteer programs wonder about how the COVID pandemic impacted their volunteer programs. This blog post will show you how to use the tools in Volgistics to get a percentage for the number of volunteers who are serving again compared with the number that were serving before the shutdown.
To start, you’ll build a Set to query the database and return the volunteers who were active before everyone was sent home. To do this:
- Select Sets from the menu.
- Click the Create a new set button.
- Give your Set a name such as Pre-Pandemic Volunteers.
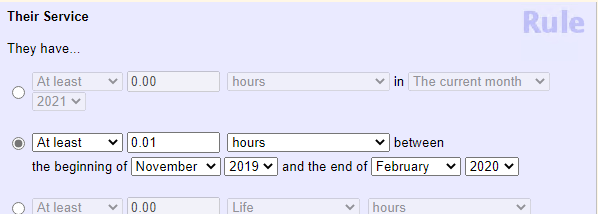
- Under Include volunteers in this set based on, select Their service and then click the Go button.
- Set the rule to find volunteers who had service recorded during the months before the shutdown. For our example, we’ll use December 2019 to February 2020 because March was interrupted.
- Click the Finished button.
After you create your first Set, build a second Set following the same steps except in step 5 select a month range that reflects hours after volunteers returned to service. For our example, we’ll pick March 2021 to June 2021 because that’s when volunteers were allowed to start returning in Michigan when things started opening back up.
When you have the two Sets, follow these steps to get the numbers you’ll use to calculate the percentage.
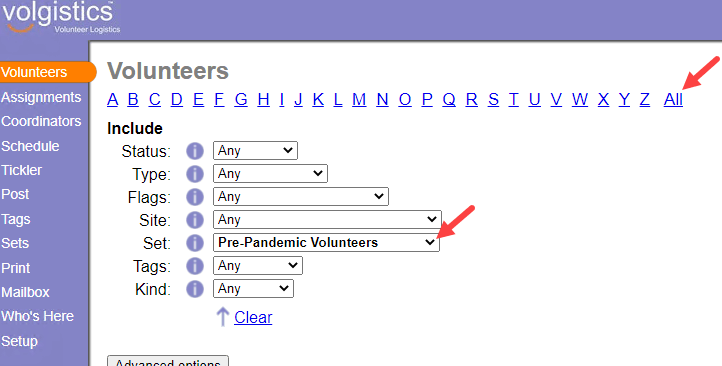
- Select Volunteers from the menu.
- Pick your first Set from the Set dropdown and make sure the other filters have Any selected.
- Click the All link to the right of the row of letters.
There will be a count for how many volunteers are in the Set toward the top left of the page.
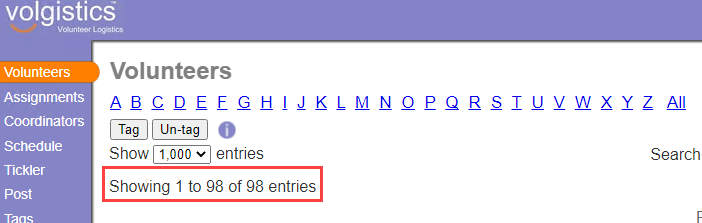
Make a note of this count and then follow the same steps except select the other Set you made in step 3. We’ll say our second Set identified 62 volunteers with hours after the pandemic.
Once you have the figures, divide the number of volunteers who are active now by the number of volunteers who were active before the pandemic.
62 ÷ 98 = 0.63265 . . . .
Adjust the quotient by moving the decimal point two spots to the right to get your percentage (63.265 . . ..). You could round this off to say that your volunteer force has 63 % of volunteers serving compared to before the pandemic.
We know that this is not a completely accurate picture of who has returned. For example, some volunteers who are serving now may be new to your program. But this will give you a pretty good idea of how your volunteer program is doing as people start serving again. You may want to consider making a third Set later in the year to gauge the progress that has been made as more and more volunteers are vaccinated and ready to serve.
Don’t like YouTube? Click here instead.